
The Data
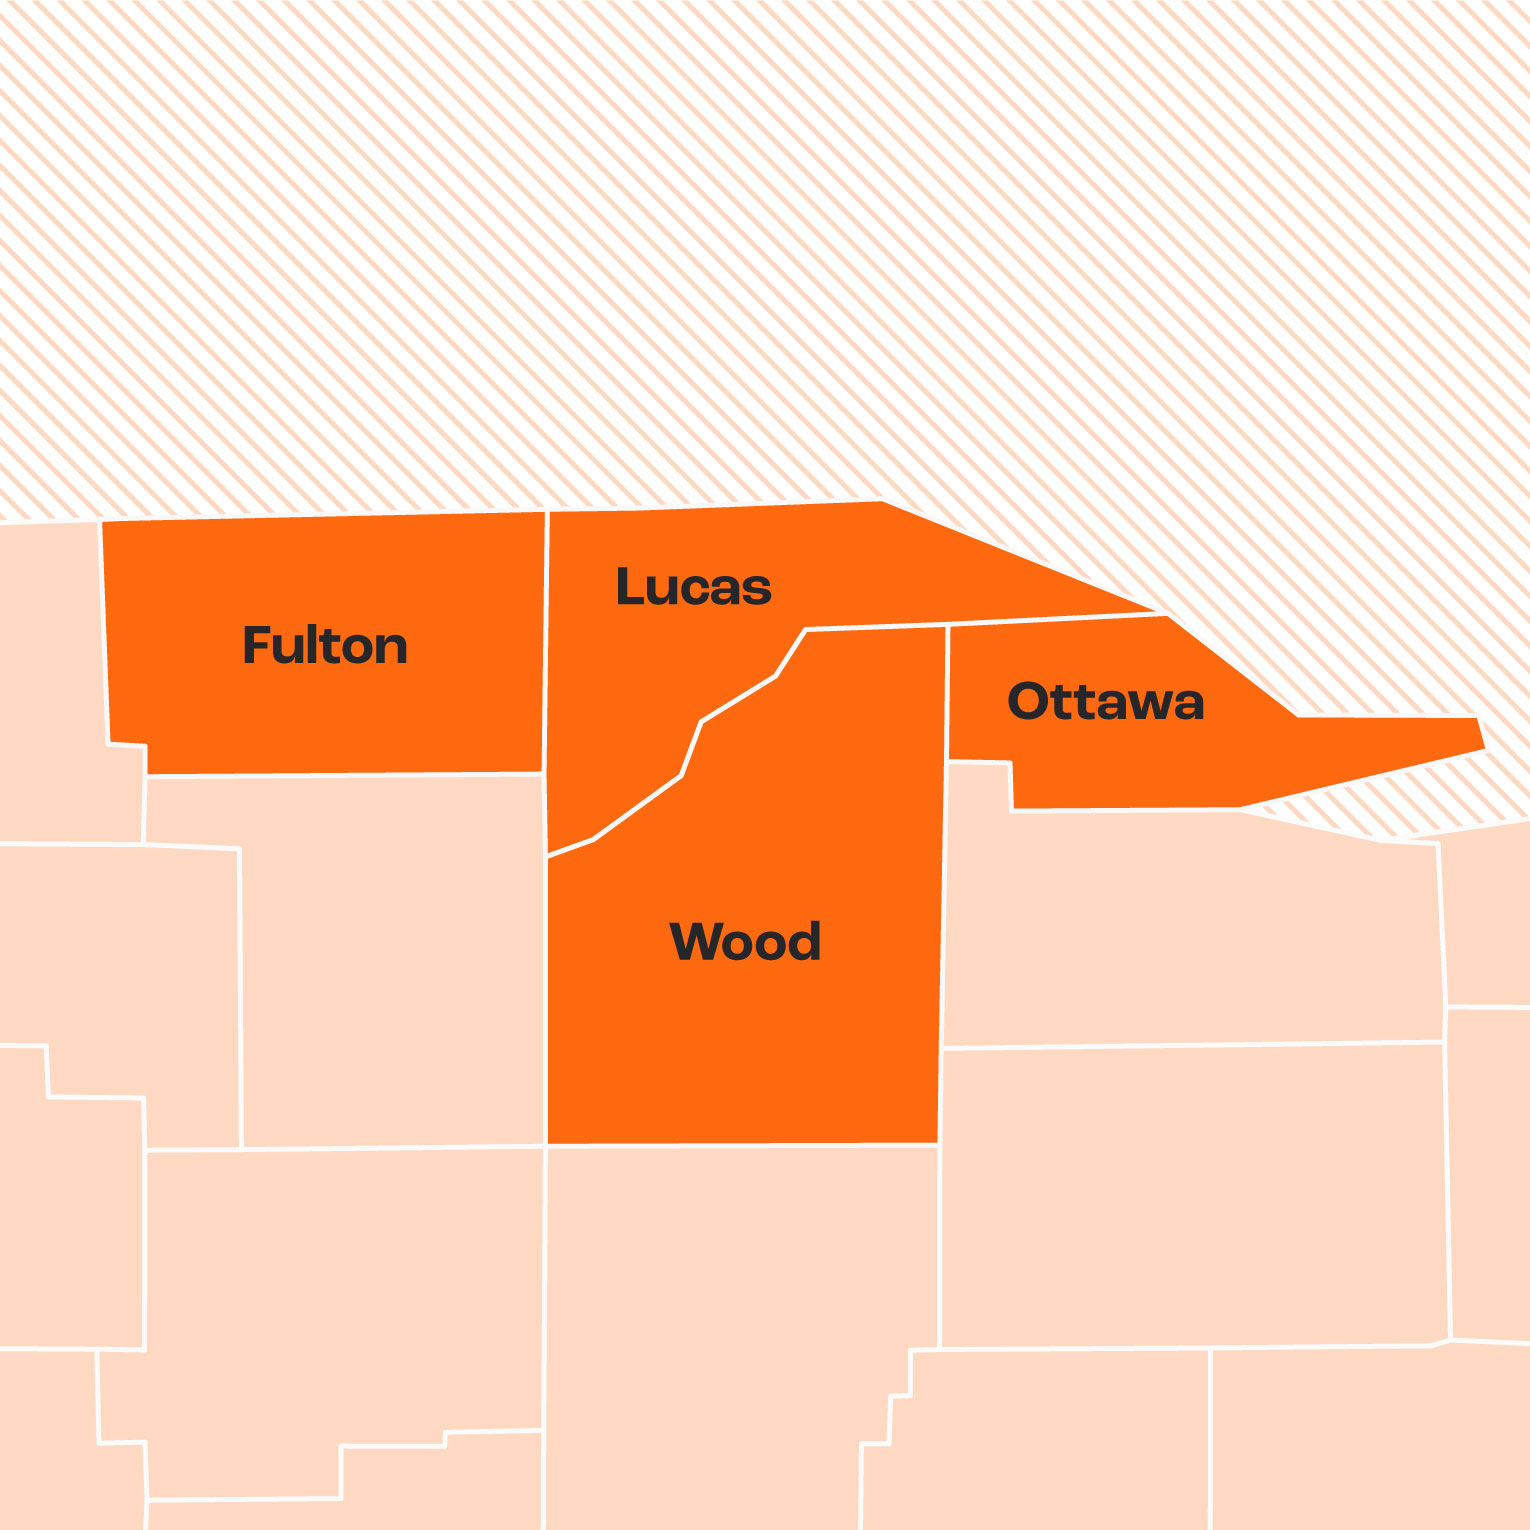
Community of Excellence 2026: Toledo Region
This multi-stage development plan will identify the region’s biggest barriers to true prosperity and equity, create actionable solutions to address them, and track our progress regularly as we move toward and away from our ultimate goal using this convenient, comprehensive dashboard.
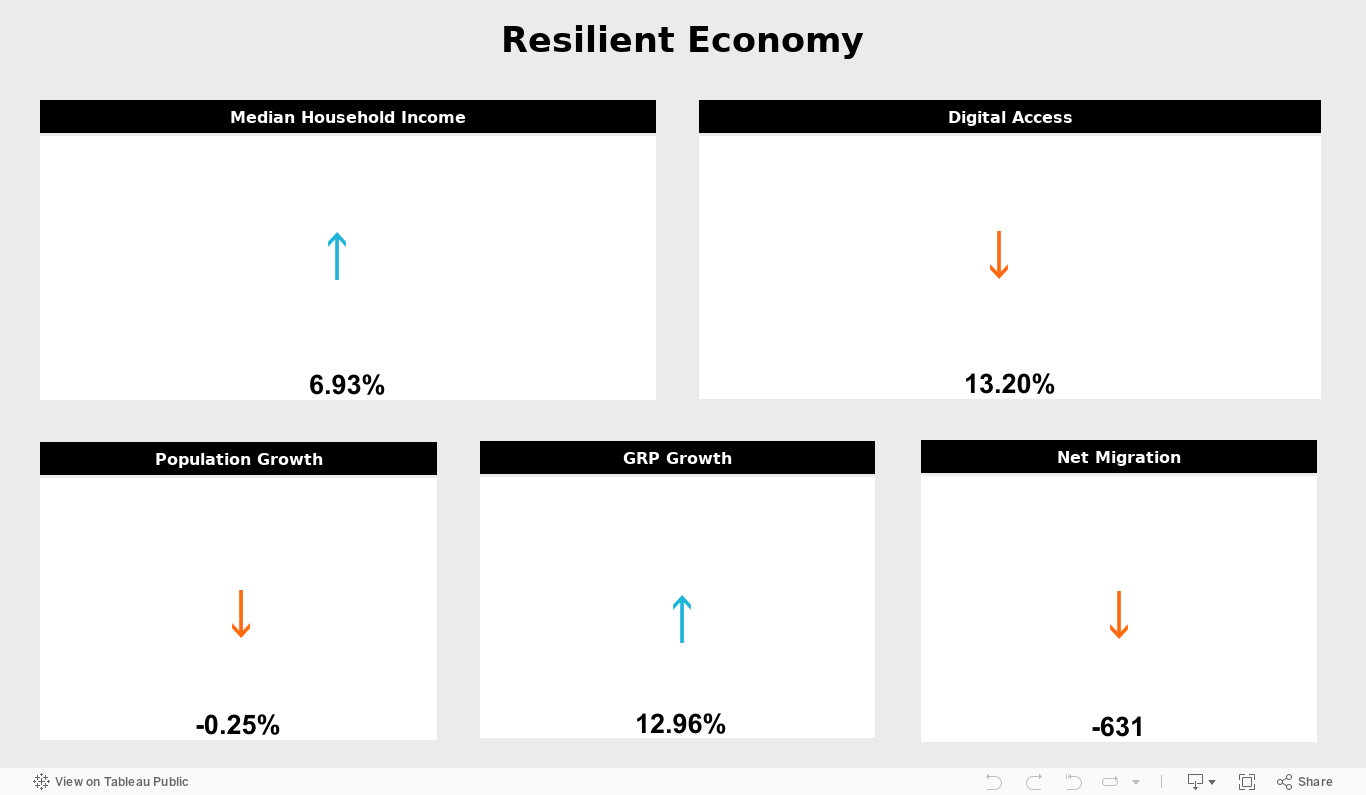
A Dashboard to Measure Progress in Real Time
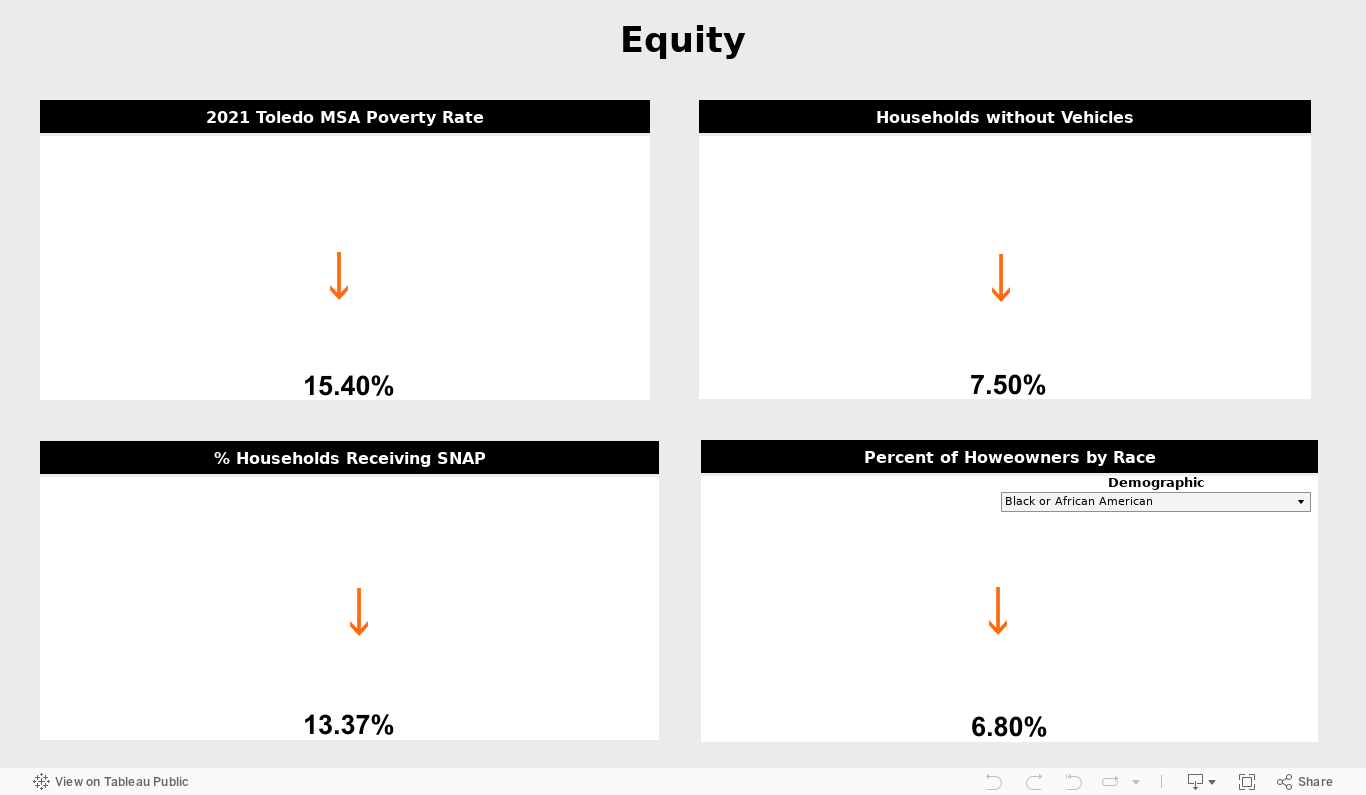
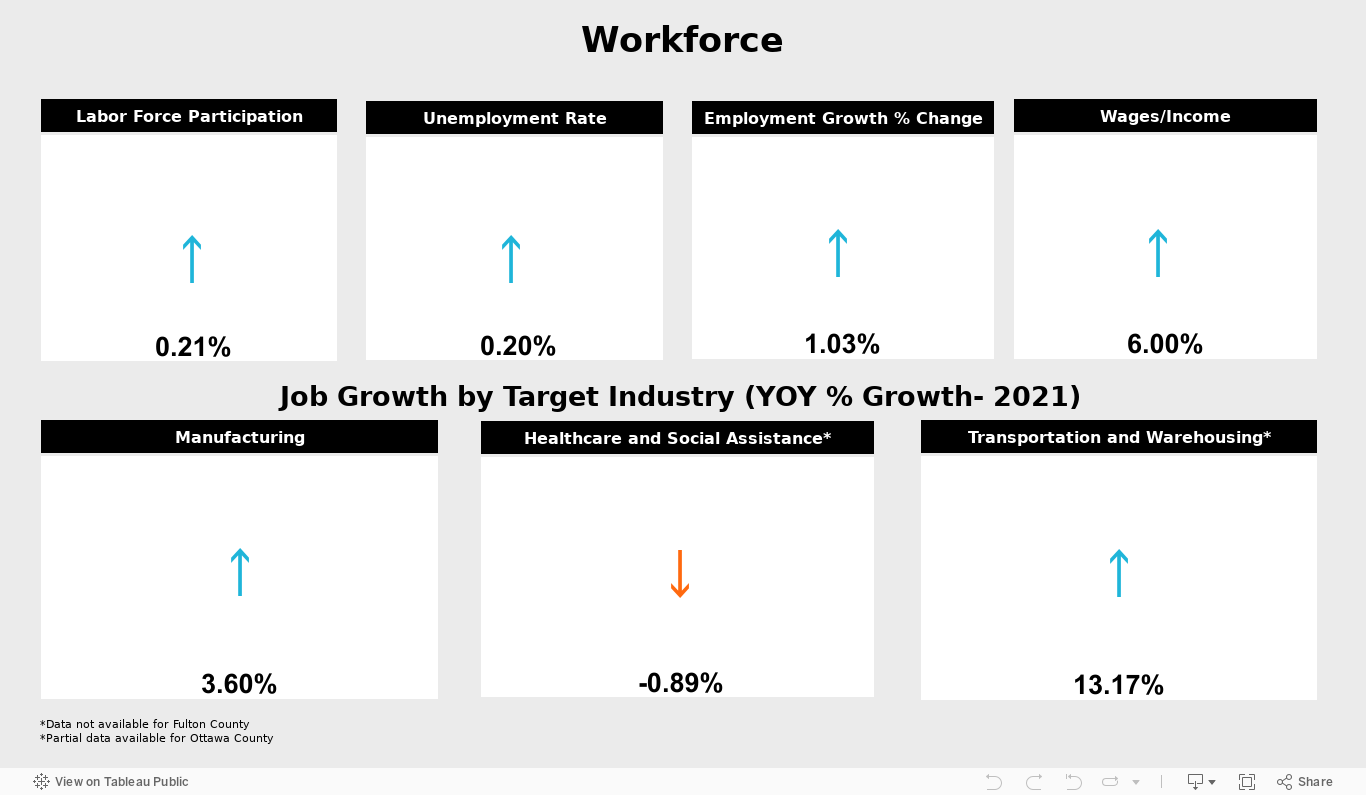
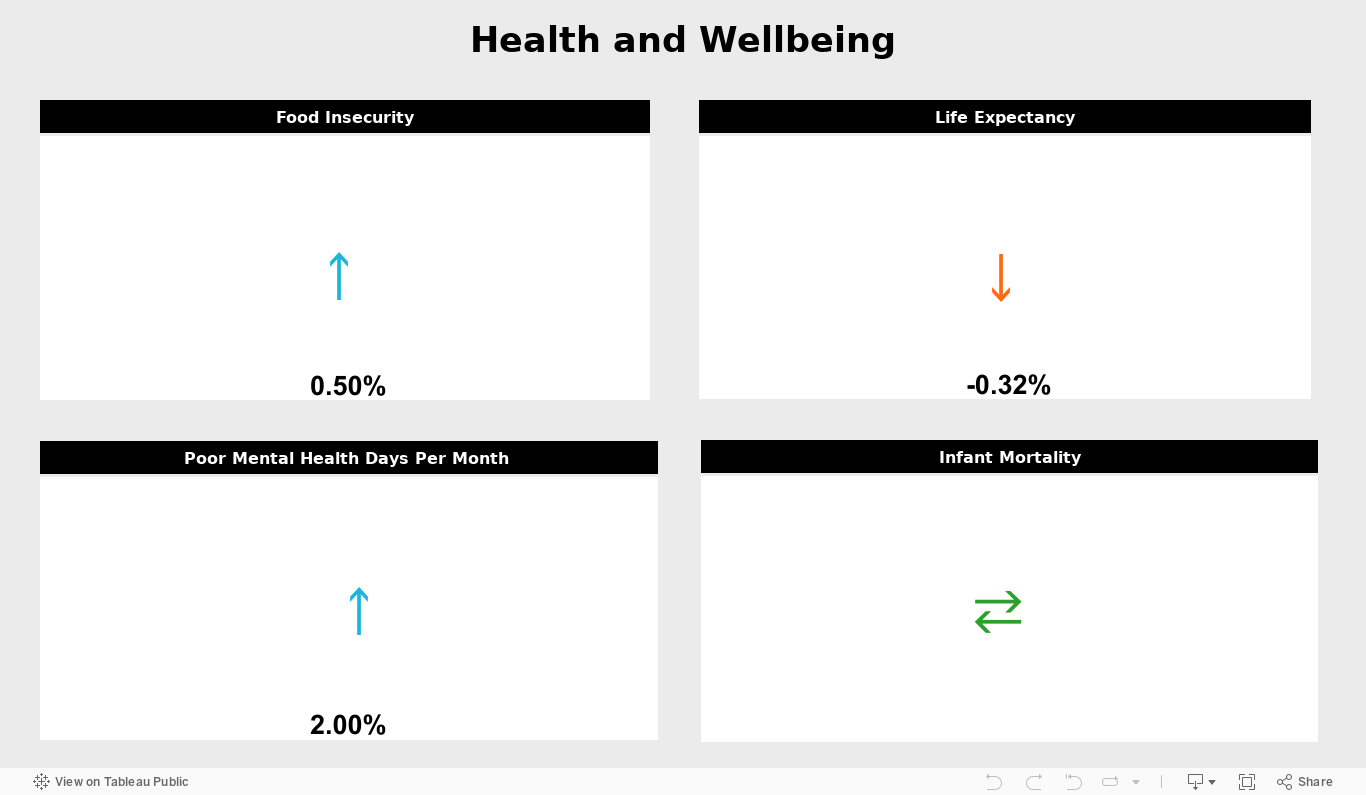
The up and down arrows provide a snapshot of how each metric has changed—whether the numbers are up or down since our previous analysis. Keep in mind that “up” isn’t always positive, and “down” isn’t necessarily negative. For more insight into any individual metric, click the symbol to drill deeper into our data.


Gathering Meaningful Data,
Analyzing It Against Relevant Benchmarks.
Quality of life relies on a holistic approach to regional advancement, which is why we’ve included diverse metrics like population change, employment participation, wage and income, and health outcomes.
The committee has identified these metrics as key to our success as a Community of Excellence, and to achieving our vision for a community where everyone can—and does—thrive.
We’re committed to tracking and sharing the region’s successes and shortcomings, including how we compare to our current and aspirational peers.
Success doesn’t happen overnight and progress isn’t always linear. It’s trends that matter. By collecting data over time, we can show the region’s growth—and decline—in each key area.
Look to the Trends to
Understand the Story
Workforce Development
A right-skilled, well-suited workforce often leads to higher levels of job satisfaction, retention, and productivity, as well as lower unemployment and economic prosperity for all.
Economic Development
Building a prosperous regional economy tends to create more available jobs, more desirable industries, business growth, greater resilience, and higher quality of life.
Education
Educational attainment and alignment typically result in a better-prepared graduation class that can more effectively navigate the job market, workforce, and career disruptions.
Health and Wellbeing
A cornerstone of quality of life, wellbeing is an important indicator that the community has access to necessary social services, facilities, education, and effective care.
Culture, Arts, Recreation, and Amenities
Communities with greater access to enriching experiences like theatre, museums, parks, natural beauty, and more tend to express greater overall happiness.
Diversity, Equity, and Inclusion
Diverse and inclusive communities typically thrive both socially and economically—they’re not only more accepting and inviting, but also generally more innovative and entrepreneurial, which can create conditions of greater job fulfillment, wealth distribution, and happiness.
This Dashboard Allows for Continued Progress as a Region
Enables the COE to benchmark progress on collective goals over time
Increases efficiency in progress tracking and data access
Creates an environment for success by allowing more functional and effective systems and strategies to be prioritized
Ensures public accountability and access to strategies, metrics, and progress reports
Empowers community organizations to use the data to prioritize community actions and resource allocations, and to implement performance improvement systems